-
YumaPOS
-
- The YumaPOS Ecosystem
- Plan Where You Want to be in 6 and 12 Months from Now
- Create Your YumaPOS TENANT
- Create STORES in your YumaPOS TENANT
- Make Life Easy : Preset Some Basic Settings
- Which is best for You? Manual Entry or Data Import?
- Great Structure Makes Selling Easier
- Positive Planning Prevents Poor Performance
- POS and ORDER Fundamentals
- Getting to Know Your New BOM
- Cheap Internet Can Cost Businesses Time, Money and Productivity
- Security : Do you Really Want Your Staff Doing That?
- Stock Control: What It Is and How to Know If It’s Right for Your Business
- Scale Your Business : YumaPOS for Single to Franchise Growth
- A Quick Guide to Where ITEM Cost Comes From
- Know Your Customers, Earn Their Loyalty, Grow Your Sales
- Yumapos Price Lists, Holiday Promotions & Surcharging - Made Easy
- Show Remaining Articles (2) Collapse Articles
-
-
- Quickly List Transactions Created by Your STORES and APPs
- Easily See Transactions by Staff Member
- It is Simple to Track Sales by Terminal
- Processing Order Tracking: How to Minimise Operational Loss
- Voided Orders Explained: Why You Need to Catch Them
- Action Logs: Why they are Important to Your Business
-
-
- Articles coming soon
-
- Articles coming soon
-
- Articles coming soon
-
- Articles coming soon
-
- Articles coming soon
-
- Articles coming soon
-
-
-
- Articles coming soon
-
- Articles coming soon
-
- Articles coming soon
-
- Articles coming soon
-
- Articles coming soon
-
- Articles coming soon
-
- Articles coming soon
-
- Articles coming soon
-
- Articles coming soon
-
- Articles coming soon
-
- Articles coming soon
-
- Articles coming soon
-
- Articles coming soon
-
-
-
- Articles coming soon
-
- Articles coming soon
-
- Articles coming soon
-
- Articles coming soon
-
- Articles coming soon
-
- Articles coming soon
-
- Articles coming soon
-
- Articles coming soon
-
-
-
- Articles coming soon
-
- Articles coming soon
-
- Articles coming soon
-
- Articles coming soon
-
-
-
- Articles coming soon
-
- Articles coming soon
-
- Articles coming soon
-
- Articles coming soon
-
- Articles coming soon
-
- Articles coming soon
-
-
-
- Articles coming soon
-
- Articles coming soon
-
- Articles coming soon
-
-
-
- Articles coming soon
-
- Articles coming soon
-
- Articles coming soon
-
- Articles coming soon
-
- Articles coming soon
-
-
-
- Articles coming soon
-
- Articles coming soon
-
- Articles coming soon
-
- Articles coming soon
-
-
-
- Articles coming soon
-
- Articles coming soon
-
- Articles coming soon
-
- Articles coming soon
-
-
- Articles coming soon
-
-
- Articles coming soon
-
- Articles coming soon
-
- Articles coming soon
-
- Articles coming soon
-
- Articles coming soon
-
- Articles coming soon
-
- Articles coming soon
-
- Articles coming soon
-
- Articles coming soon
-
- Articles coming soon
-
- Articles coming soon
-
-
-
- Articles coming soon
-
- Articles coming soon
-
- Articles coming soon
-
- Articles coming soon
-
- Articles coming soon
-
- Articles coming soon
-
- Articles coming soon
-
- Articles coming soon
-
- Articles coming soon
-
- Articles coming soon
-
- Articles coming soon
-
-
-
- Articles coming soon
-
- Articles coming soon
-
- Articles coming soon
-
- Articles coming soon
-
- Articles coming soon
-
- Articles coming soon
-
-
- Articles coming soon
-
- Articles coming soon
-
- Articles coming soon
-
- Articles coming soon
-
- Articles coming soon
-
- Articles coming soon
-
- Articles coming soon
-
-
- Articles coming soon
-
- Articles coming soon
-
- Articles coming soon
-
- Articles coming soon
-
- Articles coming soon
-
- Articles coming soon
-
- Articles coming soon
-
-
- Articles coming soon
-
-
-
YumaPAY
Easily See All Your Stores With YumaPOS Dashboard
BOM Dashboard
The Back Office Dashboard helps you track the status of sales in all your stores. Through Dashboard, you have a single point of access to financial information on each store, and a clear view into customer interest in particular items.
Log In
Use the details provided to you, by your YumaPOS support team, to access your back Office management console.
Open Dashboard
- In the left pane of the Back Office Management console, click Dashboard.
- From the Store list, select a store of interest or All Stores to display a summary of key indicators for all your stores.
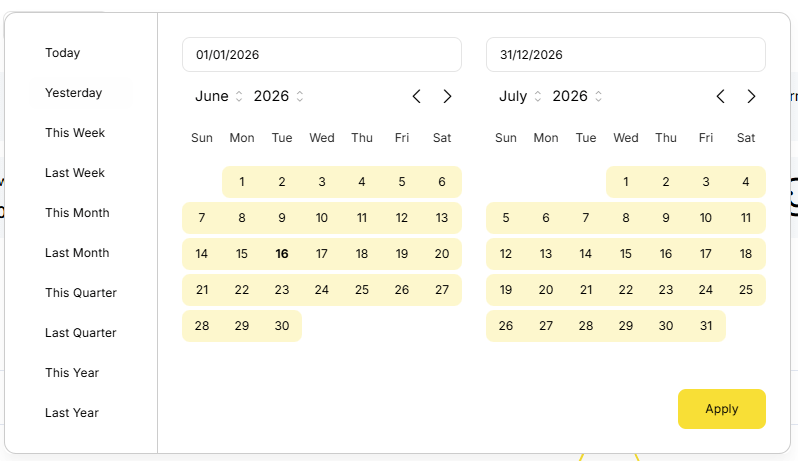
- Using the Period list, specify the last period to display information for (such as Last month, This month, Last year, or Custom period).
- Click Apply to display data for specified store and period.
Filters
Check the next article for a discussion on FILTERS as they are everywhere.
Data will be presented differently depending on the chosen FILTERS.
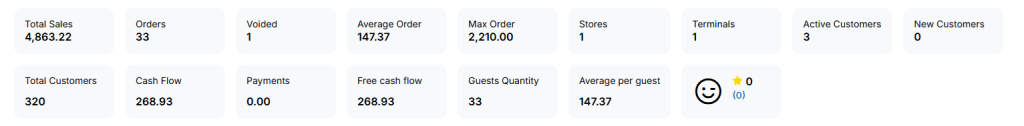
Key Performance Indicators
With no FILTERS set, this will default to ALL STORES for TODAY.
Data includes :
- Total Sales
- Number of ORDERS processed
- Number of VOIDs
- Average ORDER value
- Maximum ORDER value
- Number of STORES
- Number of TERMINALS
- Active CUSTOMERS
- New CUSTOMERS
- Total CUSTOMERS
- Cash Flow
- Payments
- Free Cash Flow
- Guests Quantity
- Average Spend
- Customer Feedback
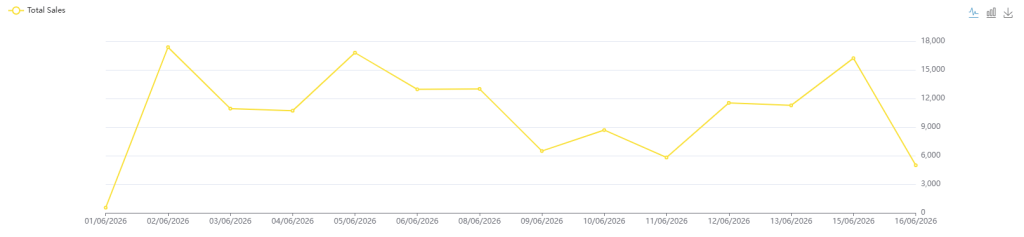
Total Sales
Please note the ability to change from Line Graph to Bar Graph and to download as PNG.
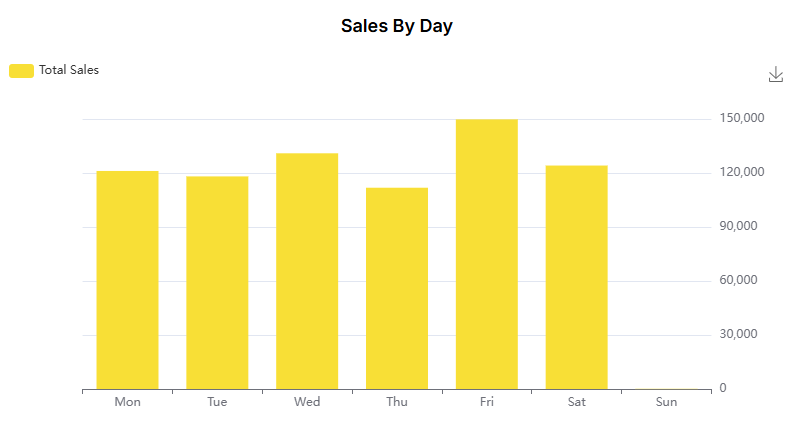
Sales by Day
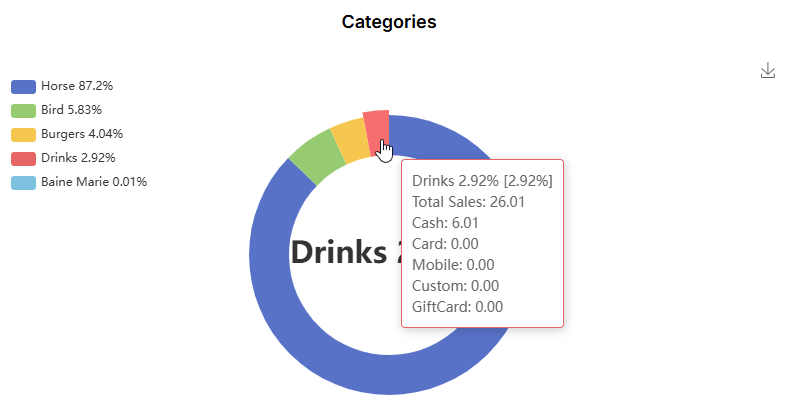
Sales by Categories
Hover your mouse for a breakdown by % and PAYMENT METHOD.
Please note that if you are using SUB-CATEGORIES you will be able to drill down for greater detail.
Sales by Tags
YumapOS let’s you assign predefined TAGS to your MENU ITEMS, STORES. etc
You can then use these TAGS for gathering statistical information.
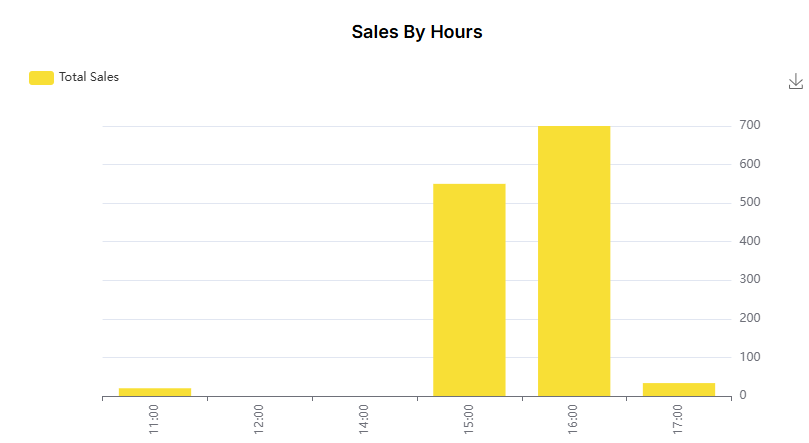
Sales by Hour
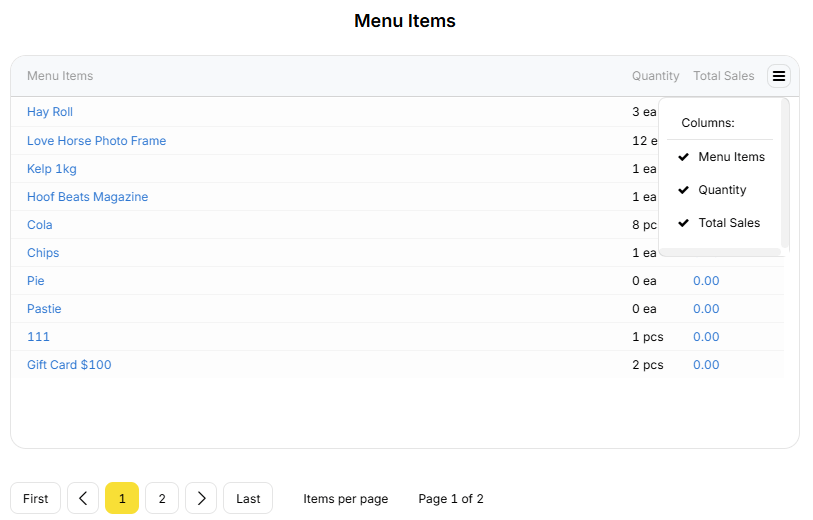
Sales by Items
View your top selling ITEMS in the selected period.
- Item
- Quantity
- Dollar
Please note the ability to toggle visible FIELDS and step through PAGES.
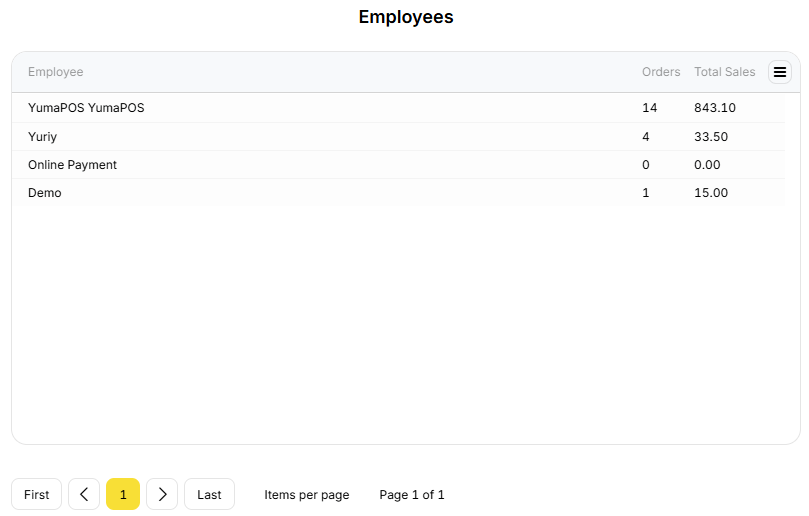
Sales by Employee
View your staff performace in the selected period.
- Employee
- Number of ORDERS
- Total Sales
Please note the ability to toggle visible FIELDS and step through PAGES.
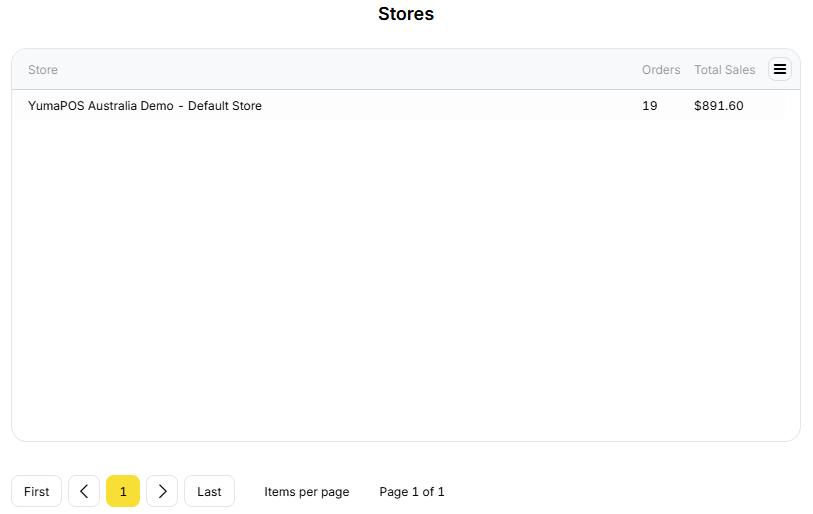
Sales by Store
View your staff performance in the selected period.
- Store Name
- Number of ORDERS
- Total Sales
Please note the ability to toggle visible FIELDS and step through PAGES.
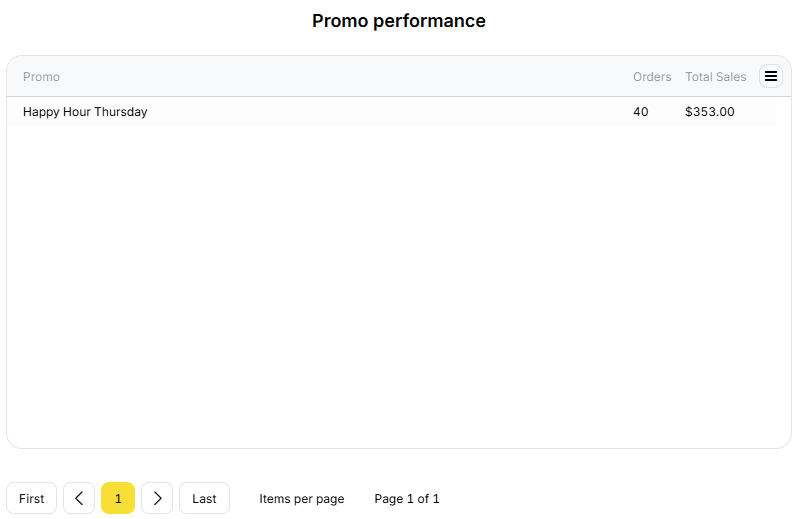
Promo Performance
Remembering that a PROMOTION is a way to take a given set of CRITERIA and make SOMETHING happen, you can monitor how well they are working in the chosen period.
- Promotion Name
- Number of ORDERS
- Total Sales